U.S. Ethereum spot ETFs recorded a combined net outflow of $92.5448 million on March 26, 2026, extending a losing streak to seven consecutive trading days as institutional investors continue pulling capital from ether-linked products amid deepening market fear.
Ethereum ETFs Shed $92.5M in a Single Day
The $92.5448 million net outflow was driven primarily by BlackRock’s ETHA fund, which alone saw $140 million exit the product on March 26, according to PANews citing SoSoValue data. ETHA remains the largest Ethereum spot ETF by cumulative inflows at $11.697 billion, but that base is now shrinking daily.
One notable exception partially offset the damage. BlackRock’s newer ETHB product, a staked-ETH ETF, pulled in $96.8058 million in net inflows on the same day. The divergence suggests institutional capital is not abandoning Ethereum exposure entirely but rotating toward yield-bearing vehicles.
Total net asset value across all U.S. Ethereum spot ETFs stands at $11.702 billion, representing roughly 4.7% of Ethereum’s total market capitalization. Cumulative historical net inflows remain positive at $11.571 billion, but the current streak is chipping away at that figure.

Seven Consecutive Days of Outflows: How Deep Is the Hole?
March 26 marked the seventh straight trading day of net redemptions from Ethereum spot ETFs. The streak, which began around March 20, reflects a broader pattern of institutional retreat that has persisted throughout the month.
The ETHA-ETHB split on March 26 highlights a structural divergence within the Ethereum ETF landscape. When the SEC approved spot Ethereum ETFs in mid-2024, it explicitly prohibited staking within those products. BlackRock’s subsequent launch of ETHB, which offers staking yield, now appears to be cannibalizing flows from its own non-staking predecessor, a dynamic that could reshape how institutions position around Ethereum going forward.
The sustained outflow streak stands in contrast to the product class’s overall trajectory. Since launching in July 2024, Ethereum spot ETFs have attracted $11.571 billion in cumulative net inflows. But March 2026 has been a particularly brutal month, with broader crypto market selling pressure compounding the trend.
What the Outflows Signal for ETH and Institutional Appetite
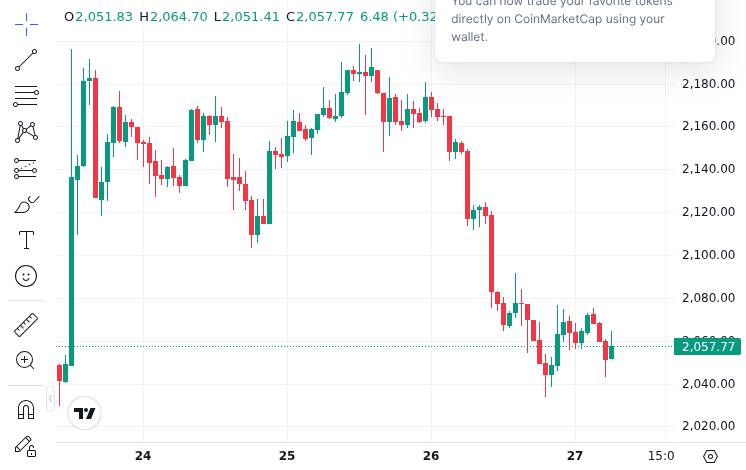
ETH traded at approximately $2,059.97 on March 27, down 3.82% over the prior 24 hours. The token has fallen an estimated 30% to 60% from its 2025 peak, placing it squarely in a prolonged drawdown that has eroded investor confidence.
The Crypto Fear & Greed Index sits at 13, deep in “Extreme Fear” territory. That reading aligns with the institutional behavior visible in ETF flows: capital is leaving risk assets broadly, and Ethereum is no exception. As recent market developments suggest, macro headwinds including elevated volatility and stagflation concerns continue to weigh on crypto allocations.
CryptoQuant analysts have noted that “capital flows now explain ether’s price better than on-chain usage,” pointing to a disconnect between Ethereum’s record network activity, roughly 2 million daily active addresses, and its declining price. The implication is that institutional fund flows, not blockchain fundamentals, are currently the dominant price driver.
The ETHA versus ETHB divergence may prove to be the more consequential story. If staked-ETH products continue attracting inflows while non-staking ETFs bleed, the SEC’s original prohibition on staking within approved ETF structures could become a growing competitive disadvantage for first-generation Ethereum spot products. Whether issuers push for amended terms, or investors simply migrate to newer yield-bearing alternatives, the seven-day outflow streak may be symptomatic of a structural shift rather than a temporary sentiment dip.
ETH’s 24-hour trading volume reached $18.31 billion on March 27, suggesting liquidity remains robust even as directional flows turn negative. With Ethereum’s market cap at approximately $248.23 billion, the 4.7% ETF ratio means institutional ETF positioning, while meaningful, still represents a fraction of total market exposure.
Disclaimer: This article is for informational purposes only and does not constitute financial or investment advice. Cryptocurrency and digital asset markets carry significant risk. Always do your own research before making decisions.


