Crypto futures markets saw $73.1331 million in contract liquidations over the past 24 hours, with long positions accounting for nearly 72% of the total. The lopsided flush signals that leveraged bulls were caught off-guard by a broad market downturn, as Bitcoin and Ethereum both traded in the red.
$73.13 Million Liquidated Across Crypto Markets in 24 Hours
A total of $73.1331 million in crypto futures contracts were forcibly closed over the 24-hour period ending March 29, 2026, according to data from CoinAnk cited by PANews.
Long positions bore the brunt of the damage, with $52.539 million in long liquidations compared to $20.594 million on the short side. That puts the long-to-short ratio at roughly 72% to 28%, confirming that the sell-off hit bullish traders hardest.
For readers unfamiliar with the mechanics, a liquidation occurs when a leveraged position loses enough value that the trader's margin falls below the exchange's maintenance threshold. The exchange then automatically closes the position to prevent further losses, converting paper losses into realized ones.
Bitcoin accounted for $15.2367 million in liquidations, while Ethereum followed closely at $14.2446 million, making them the two largest single-asset contributors to the total.
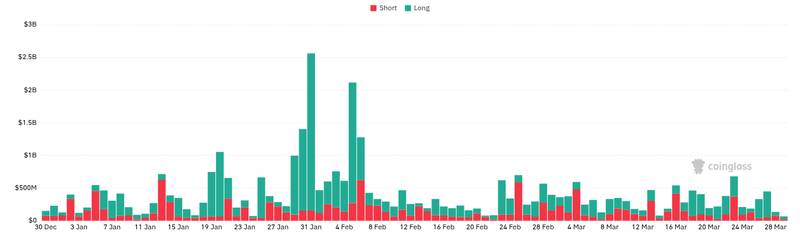
Separate live data from Coinglass showed a higher 24-hour total of $100.34 million in liquidations, with $72.03 million in longs and $28.30 million in shorts. The discrepancy likely reflects differences in exchange coverage between CoinAnk and Coinglass, though both platforms confirm the same directional pattern: longs dominated at roughly 72% of total liquidations.
Why Long Positions Dominated the Liquidation Losses
Long liquidations are triggered when asset prices fall below the liquidation threshold set by the exchange. In a declining market, traders who bet on rising prices with leverage are the first to get wiped out.
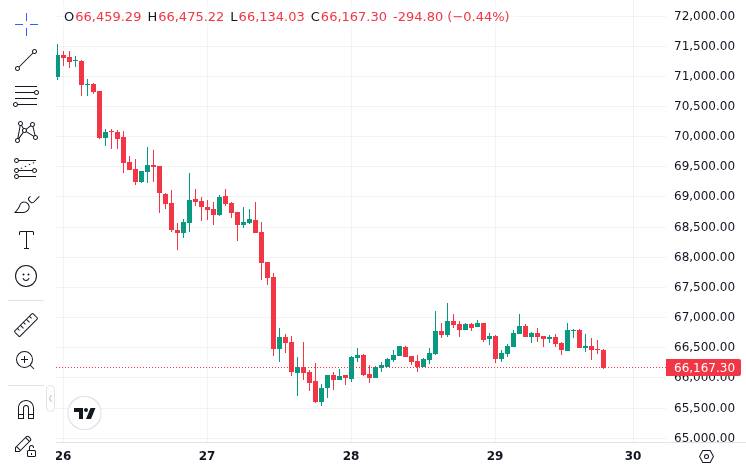
Bitcoin traded at $66,192, down 0.95% over 24 hours, while Ethereum slid 1.64% to $1,988.51. Neither move was dramatic in isolation, but for traders running high leverage, even modest declines can trigger forced closures.
What makes these liquidations notable is not just the size but the cascade effect. When a cluster of long positions gets liquidated, the forced selling adds downward pressure on the asset's price. That in turn pushes more leveraged longs toward their liquidation thresholds, creating a chain reaction that can amplify an otherwise routine dip.
The 72% long-side concentration tells us that the derivatives market was heavily skewed bullish heading into this downturn. Traders had positioned for upside despite what turned out to be unfavorable conditions, a scenario reminiscent of how Tom Lee predicted the end of a crypto winter cycle, with market participants frequently front-running expected recoveries.
What the Liquidation Data Signals for Market Sentiment
The Crypto Fear & Greed Index sat at 9 out of 100 on March 29, a reading classified as "Extreme Fear." That score reflects deeply bearish sentiment across the market, a backdrop that made aggressive long positioning particularly risky.
A $73 million liquidation day, while significant, falls well below the multi-hundred-million-dollar events that accompany major market crashes. The figure suggests a moderate deleveraging rather than a capitulation-level event.
Still, the pattern carries a warning. Persistent long-heavy liquidations can indicate a market in the process of resetting excessive bullish positioning. When traders keep getting liquidated on the long side, it means the crowd's directional bias is repeatedly misaligned with actual price action, something that has historically preceded extended periods of choppy or bearish conditions.
Traders monitoring the derivatives landscape typically watch complementary indicators alongside liquidation data. Open interest, which measures the total value of outstanding futures contracts, can reveal whether new leverage is entering the market or being flushed out. Funding rates, the periodic payments between long and short holders, show whether one side is paying a premium to maintain positions. As regulatory frameworks continue evolving across jurisdictions, including recent efforts like Hong Kong's Web3 policy alliance discussions, derivatives markets remain a closely watched barometer of broader crypto health.
With Bitcoin dominance at 56.06% and the total crypto market cap at $2.37 trillion, the market structure suggests that capital is consolidating into Bitcoin rather than flowing into altcoins. For leveraged traders, the message from this week's liquidation data is clear: the market is punishing one-sided bets in a fear-driven environment, and overleveraged longs remain the most exposed. Those watching for signs of a broader market shift may find more signal in funding rates and open interest trends than in headline liquidation totals alone.
Disclaimer: This article is for informational purposes only and does not constitute financial or investment advice. Cryptocurrency and digital asset markets carry significant risk. Always do your own research before making decisions.