
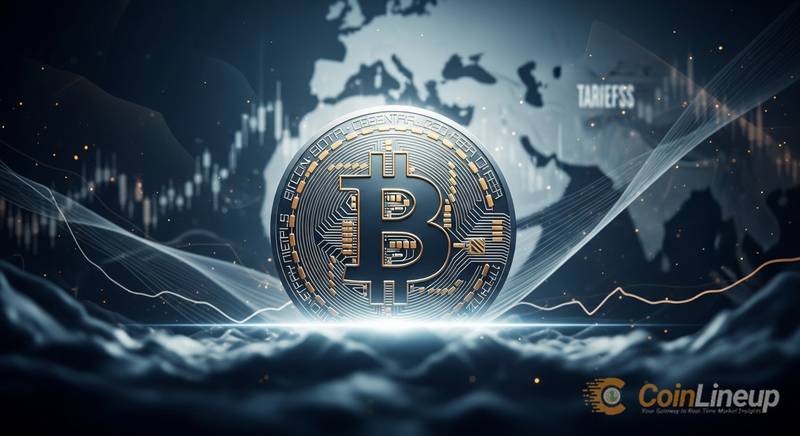
Bitcoin Price Confirms Recovery by Hitting Highest Level Since Iran War and Trump Tariff Chaos
Bitcoin has climbed to $73,567 as of March 16, 2026, its highest level since the late-February macro panic tied first to Trump tariff turmoil and then to the start of the U.S.-Iran war. After dropping to roughly $63,106-$64,000 on February 28, BTC has now rebounded about 16.6%, a move that strengthens the case that the market has shifted from panic selling to recovery.
Bitcoin Reaches Its Highest Price Since the Late-February Panic
Bitcoin traded up to a 24-hour high of $74,157 on March 16 while holding a 7-day gain of 8.81%. With 24-hour trading volume around $42.07 billion, the rebound is arriving with meaningful participation rather than a thin weekend squeeze.
That matters because the market is now back at its strongest level since the dual shock that hit risk assets in late February. BTC fell as low as roughly $63,106-$64,000 on February 28 when the war began, then spent the next two weeks absorbing repeated geopolitical headlines before grinding higher. The current price puts Bitcoin about 16.6% above that low and confirms that buyers have reclaimed the zone lost during the panic.
CoinDesk reported that each successive escalation produced a smaller selloff and a higher floor, a pattern traders often read as seller exhaustion rather than fresh downside momentum. Over the same period, Bitcoin also outperformed most major asset classes, including the S&P 500 and gold.
Even after the recovery, Bitcoin is still 41.65% below its October 6, 2025 all-time high of $126,080. That leaves room for caution, but reclaiming the highest price since the war and tariff-driven selloff began is still an important sentiment milestone for a market that looked structurally weak just two weeks ago.
Why the Iran War and Trump Tariff Chaos Mattered for Bitcoin
The current bounce only makes sense in the context of the drawdown that came first. Trump tariff chaos hit markets earlier in February 2026, with global duties in the 10%-15% range contributing to a broad risk-off move that briefly pushed Bitcoin below $65,000. Before that stress could clear, the geopolitical shock arrived.
Around February 27-28, the U.S.-Iran conflict escalated with U.S.-Israeli strikes on Iran, and Bitcoin initially traded like a risk asset rather than a defensive hedge. The market quickly slid toward the $63,106-$64,000 area, marking the panic low referenced across coverage of the move. On a 60-day basis, BTC was still down 24.15%, which shows how deep the tariff-and-war drawdown became even with the latest rebound.
The sentiment damage has not fully healed. The Fear & Greed Index sits at 23, still in Extreme Fear, even as price pushes higher. That divergence is notable because it suggests the narrative has improved faster than positioning or retail confidence, which can leave room for upside if the recovery keeps holding.
Fortune highlighted that Bitcoin’s round-the-clock market structure gave it an edge during the conflict because crypto was the only major venue open for weekend price discovery. As Gabe Selby, head of research at CF Benchmarks, told Fortune, crypto’s 24/7 structure is “increasingly an edge” during geopolitical shocks.
What Is Fueling Bitcoin’s Recovery Now
The most important technical signal is that every new war headline has done less damage than the one before it. According to CoinDesk’s market report, Bitcoin established progressively higher floors near $66,000 on March 2, $68,000 on March 7, $69,400 on March 12, and $70,596 on March 14-15. That stair-step structure is consistent with exhausted sellers and increasingly confident dip buyers.
Flows and derivatives positioning also support the move. U.S. spot Bitcoin ETFs have pulled in roughly $1.3 billion in net inflows in March 2026, which could make this the first positive flow month since October. In futures, open interest in perpetuals jumped 9% in 24 hours to around 700,000 BTC, the highest level since February 6, showing that traders are re-engaging as spot price reclaims ground.
At the same time, the 30-day average funding rate has stayed negative for 14 consecutive days. Vetle Lunde of K33 Research said in a separate CoinDesk report that this matches the longest negative streak since December 2022, a setup historically associated with local bottoms. In other words, bearish positioning has remained elevated even as price has recovered, creating fuel for further unwinds if BTC keeps pressing higher.
Macro relief helped unlock the latest leg up. Trump comments suggesting the war may be nearing an end reduced some geopolitical pressure, while Treasury Secretary Bessent’s oil-price intervention helped pull WTI crude down to about $94.50 from around $98. Wintermute OTC head Jake Ostrovskis told CoinDesk that “the oil move matters more” for crypto than the geopolitics itself, underlining how closely Bitcoin is still trading with macro liquidity conditions.
For now, Bitcoin’s recovery looks more durable than a simple relief bounce because it is backed by higher floor formation, ETF inflows, and continued short-side pressure in funding data. The risk is that sentiment is still fragile: Extreme Fear remains in place, Bitcoin’s market cap at $1.47 trillion is still well below peak-cycle levels, and any renewed war escalation or oil spike could pressure the reclaimed zone again. If BTC can keep holding above the low-$70,000s, though, the market will have a stronger case that the tariff-and-war shock has already been absorbed.
Disclaimer: This article is for informational purposes only and does not constitute financial or investment advice. Cryptocurrency and digital asset markets carry significant risk. Always do your own research before making decisions.


About the author


US Authorities Freeze $344M in Crypto Tied to Iran
US authorities froze $344 million in crypto tied to Iran, putting sanctions enforcement, seizure mechanics, and crypto compliance in focus.

Chainlink Data Services Go Live on AWS Marketplace
Chainlink data services are now live on AWS Marketplace. This article breaks down what the launch confirms, why the listing matters, and what it could signal for blockchain infrastructure distribution.
US Bankers Association Seeks 60-Day Delay for Stablecoin Rules
The US Bankers Association is urging a 60-day delay before stablecoin rules take effect. This outline focuses on the pause request, regulatory timing, and market implications.

Polymarket Paris Weather Glitch Sparks $37K Scrutiny
Polymarket faces scrutiny after traders reportedly made $37K from a Paris weather market glitch, raising fresh questions about trust and market rules.

PUSD Launches on ADI Chain in Middle East Expansion
PUSD launches on ADI Chain as part of a broader Middle East stablecoin expansion. This outline focuses on the launch, its regional context, and what readers should watch next.
Binance.US Spot Trading Fees Fall to 0% for Makers, 0.02% for Takers
Binance.US has cut spot trading fees to 0% for makers and 0.02% for takers. Here’s what changed, who benefits, and why the move matters.
Related
US Spot Bitcoin ETFs Add $1.9B in 7 Days, Led by BlackRock
US spot Bitcoin ETFs pulled in $1.9 billion over seven days, with BlackRock leading inflows. Here is what the streak signals for BTC demand.

BlackRock Bitcoin ETF Sees $900M Net Inflows in Five Days
BlackRock's Bitcoin ETF logged about $900 million in net inflows over five days, highlighting sustained investor demand and broader spot ETF momentum.

US Indo-Pacific Commander Tells Senate Bitcoin Is a Reality
A US Indo-Pacific commander told the Senate that Bitcoin is a reality. Here’s what the remark means for policy, adoption, and Bitcoin’s public narrative.
In 2010, This Bitcoin Faucet Gave Away 5 BTC Per CAPTCHA
A look back at the 2010 Bitcoin faucet that handed out 5 BTC per CAPTCHA, why it existed, and what the giveaway says about early crypto markets.
Over 80% of U.S. Bitcoin ETFs Rely on Coinbase Custody
A focused SEO outline on why more than 80% of U.S. Bitcoin ETFs depend on Coinbase for custody, and what that concentration means for markets, risk, and investor attention.

Bitcoin Halving Block #840,000: ViaBTC Mined Rare Sat
A flashback to Bitcoin block #840,000 in 2024, when ViaBTC mined the halving block and it carried a rare sat tied to a milestone in Bitcoin history.


