Bitcoin On-Chain Activity Is a Ghost Town While Corporate Products Drive Price
By Pizza
Bitcoin’s market structure is splitting into two different realities: base-layer activity looks subdued while price discovery is increasingly routed through institutional wrappers and derivatives venues. That gap does not prove any single corporate product fully controls BTC, but it does show that marginal flows are concentrating away from the chain itself.
Why Bitcoin On-Chain Activity Looks Like a Ghost Town
In this context, on-chain activity means observable base-layer usage such as transaction throughput and fee pressure, which can diverge from exchange-led price moves when trading and exposure are handled off-chain.
Glassnode reported Bitcoin daily transactions peaking near 734,000 in 2024, then cooling into a rough 320,000-500,000 range through 2025, which supports the low-participation framing behind the headline.
Current fee conditions tell a similar story: recommended rates around 3 sat/vB for fastest inclusion and 1 sat/vB for half-hour and hour targets indicate little urgency for block space.
Taken together, the 320,000-500,000 transaction band and 3/1/1 sat/vB fee profile suggest that price momentum can persist even while underlying settlement demand stays muted.
Key Takeaways
- Bitcoin base-layer usage has stayed below the 2024 transaction peak, despite continued price sensitivity to macro and flow events.
- Market activity is increasingly concentrated in ETFs and derivatives, where notional turnover exceeds on-chain settlement.
- The disconnect is structural evidence of influence, not standalone proof that one corporate product has absolute control.
How Corporate Products Are Steering Bitcoin Price Action
Glassnode’s 7-16x off-chain-versus-on-chain volume ratio shows that most BTC exposure is now expressed through venues and instruments that do not require immediate base-layer settlement.
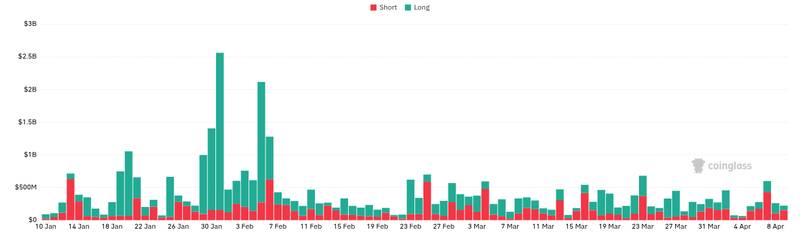
Leverage remains central to that structure, with aggregate derivatives open interest previously peaking near $114B and still sitting around $96.2B in the same dataset.
On the issuer side, the BlackRock IBIT fact sheet lists $67,386.51 million in net assets and 1,360,680,000 shares outstanding as of Dec. 31, 2025, quantifying how large regulated wrappers have become in BTC access.
The same IBIT document describes a trust structure with SEC-related disclosures, reinforcing that regulated corporate vehicles are now central to many investors’ bitcoin exposure.
That dynamic is consistent with the flow-centric setup discussed in Morgan Stanley ETF Buys 430 BTC on Debut, IBIT Pressure Rises: order-book and derivatives flows can move spot quickly, while base-layer settlement catches up later or not at all.
What the Activity-Price Disconnect Means for the Next Bitcoin Phase
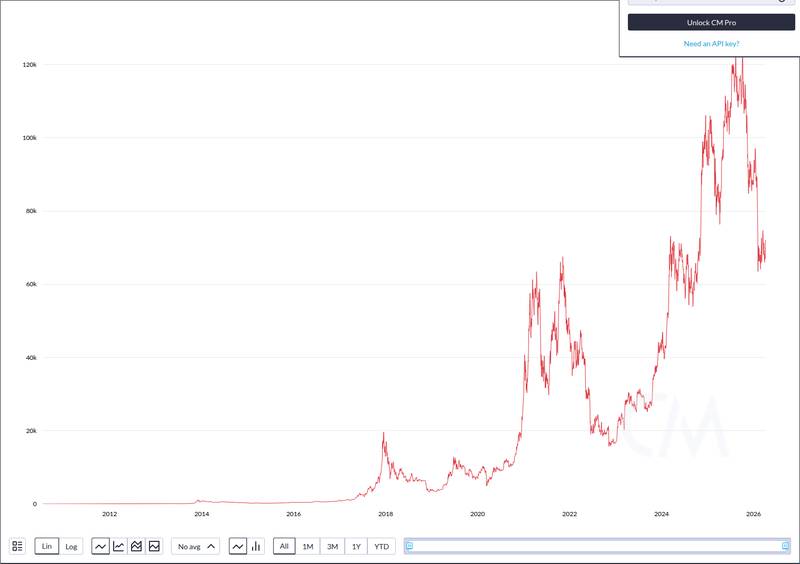
Spot context still matters: bitcoin has traded around $72,447, with roughly 1.14% 24-hour change, near a $1.45 trillion market capitalization, and close to $35.67 billion in 24-hour volume, even as on-chain usage remains comparatively soft.
Sentiment is not uniformly risk-on, with the Fear and Greed Index reading 14 (Extreme Fear), which highlights how institutional flow support and retail mood can diverge.
The practical read is scenario-based: if the 7-16x off-chain dominance holds and vehicles with IBIT-scale balance sheets keep attracting allocations, price trends can stay resilient without a matching surge in base-layer activity.
If those flows slow, however, a market still anchored by 7-16x off-chain dominance and elevated leverage near the $96.2B derivatives open-interest level can become more downside-sensitive, similar to flow shocks covered in Ethereum Foundation ETH Sales Spark Staking Credibility Questions and to broader speculative rotations tracked in 4 Top Sports Betting Apps in 2026 for High Stakes and Real Rewards.
- Monitor whether transaction throughput leaves the 320,000-500,000 zone.
- Track whether derivatives exposure stays near the $96.2B open-interest regime.
- Watch whether fee pressure lifts above the current 1-3 sat/vB baseline, which would signal stronger organic settlement demand.
For now, the 7-16x off-chain/on-chain volume split alongside the 320,000-500,000 transaction regime supports a narrower conclusion: corporate products and derivatives appear to be steering marginal BTC price discovery while on-chain participation remains comparatively quiet.
Disclaimer: This article is for informational purposes only and does not constitute financial or investment advice. Cryptocurrency and digital asset markets carry significant risk. Always do your own research before making decisions.


