A stablecoin depeg becomes dangerous when the asset backing, redemption route, or liquidity needed to restore its target stops working. UST and IRON suffered structural failures, while USDC and USDT recovered because identifiable backing and primary-market exits survived the shock.
This guide connects the historical price move to the mechanism, capital exposed, recovery time, and warning signals visible to holders. CoinLineup’s stablecoin fundamentals guide provides additional context on reserves and redemption.
What Is a Stablecoin Depeg?
A stablecoin depeg occurs when the executable market price moves materially away from its target value, usually $1. The relevant price is the amount a holder can actually receive through a liquid exchange, DEX pool, or issuer redemption route, not one isolated last trade on a thin venue.
A depeg can be temporary or permanent. A temporary discount can close when liquidity and redemptions return; a structural depeg persists when collateral disappears or the stabilization mechanism creates more losses while attempting to defend the target.
Why Do Stablecoins Depeg?
Stablecoins depeg when the arbitrage loop that should return the token to its target can no longer be executed profitably. The point of failure differs by model:
- Reserve access: cash or Treasury-backed assets exist, but banking or issuer settlement is temporarily unavailable.
- Secondary-market liquidity: sellers overwhelm exchange books or DEX pools even while primary redemption continues.
- Collateral deterioration: falling collateral values, delayed liquidations, or stale oracle inputs reduce effective backing.
- Reflexive token design: redemptions mint or sell a volatile companion token whose collapse further weakens the stablecoin.
- Contract or issuance failure: unauthorized minting, paused contracts, or broken validation floods supply or blocks exits.
These causes lead to different outcomes. A liquidity discount can recover quickly, while a failed collateral or mint-and-burn mechanism can leave no credible route back to the target.
Timeline of Major Stablecoin Depeg Events
The timeline covers six events documented in Spark’s depeg history, then tests each one against a different failure path. Prices varied across exchanges, so each low should be read as an observed market snapshot rather than one universal execution price.
| Date | Stablecoin | Model | Lowest observed price | Capital or exposure marker | Recovered | Recovery time |
|---|---|---|---|---|---|---|
| Mar. 12, 2020 | DAI | Crypto-backed | About $1.11 premium | About $8.3M collateral liquidated for zero DAI | Yes | About two weeks |
| Jun. 16, 2021 | IRON | Partially algorithmic | Below $0.75 | About $2B exposed | No | Not applicable |
| May 7-13, 2022 | UST | Algorithmic | $0.044 | About $38B combined UST and LUNA value lost | No | Not applicable |
| May 12, 2022 | USDT | Fiat-backed | About $0.945, venue dependent | $83.2B market capitalization | Yes | Less than 24 hours |
| Mar. 10-13, 2023 | USDC | Fiat-backed | About $0.87 | $3.3B of reserves held at SVB | Yes | About three days |
| Apr. 2, 2025 | FDUSD | Fiat-backed | About $0.87 | About $2.5B market capitalization | Yes | About one day |
The table separates price from recoverability. DAI shows that a stablecoin can trade above its target when collateral demand and liquidation stress collide; UST and IRON lost the mechanism supporting the peg; and USDC, USDT, and FDUSD recovered after confidence or liquidity returned.
1. DAI: the Black Thursday liquidation failure
DAI’s March 2020 event was not a permanent loss of the token’s target. It was a failure in the collateral auction process during a rapid ETH sell-off: Ethereum congestion and extreme gas costs prevented enough keepers from bidding, while some auctions cleared at zero DAI. The result was roughly $8.3 million of collateral losses even as DAI traded above $1 because borrowers were scrambling to repay debt.
The MakerDAO Black Thursday account and Maker auction documentation show why the event matters for depeg analysis. Collateralization alone did not protect vault users when the liquidation layer could not execute. The later response changed auction parameters, expanded keeper participation, and addressed the shortfall through governance.
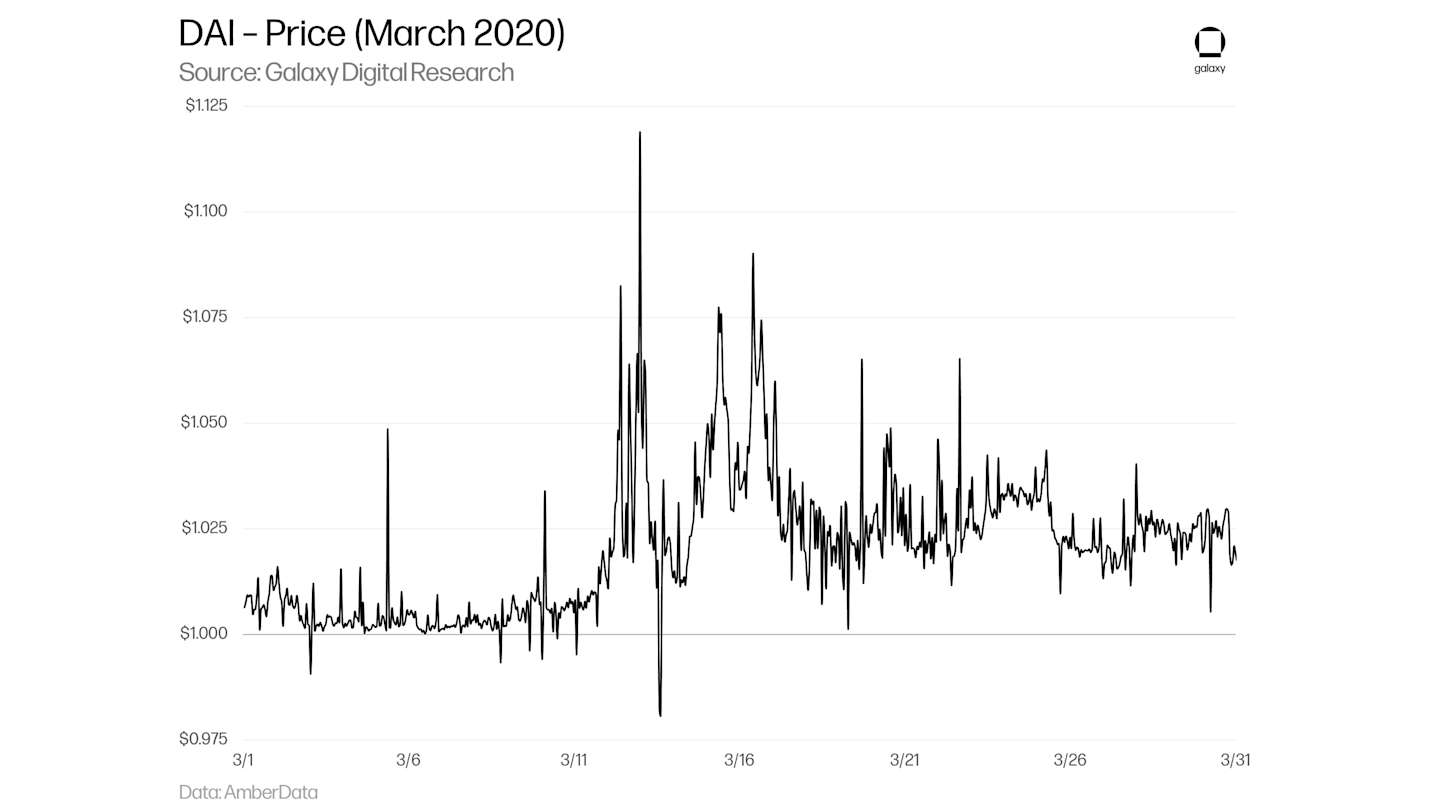
The practical lesson is different from UST: monitor oracle freshness, auction participation, gas conditions, collateral ratios, and bad debt before judging DAI’s peg. A token near $1 can still conceal losses inside the collateral system, while a temporary premium can signal that users are deleveraging rather than that the design is stable under every stress.
2. Iron Finance IRON: partial collateral did not stop a reflexive run
IRON combined stablecoin collateral with the volatile TITAN share token. When redemption pressure and TITAN selling reinforced each other, the volatile part of the backing could no longer support the target value. The case shows that “partially collateralized” is not a middle ground that automatically limits loss; the quality and liquidity of each collateral component matter during a run.
Iron Finance also differs from UST. Both designs depended on a volatile secondary token, but falling confidence weakened the collateral asset and accelerated redemptions through different mechanisms.
The Federal Reserve’s transaction-level IRON and TITAN study found that IRON used a ten-minute weighted-average TITAN price while TITAN’s spot price was collapsing. The collateral-ratio adjustment of 0.25% per hour was too slow; TITAN fell from about $60 to zero, and IRON settled near its roughly 75% USDC-backed portion.
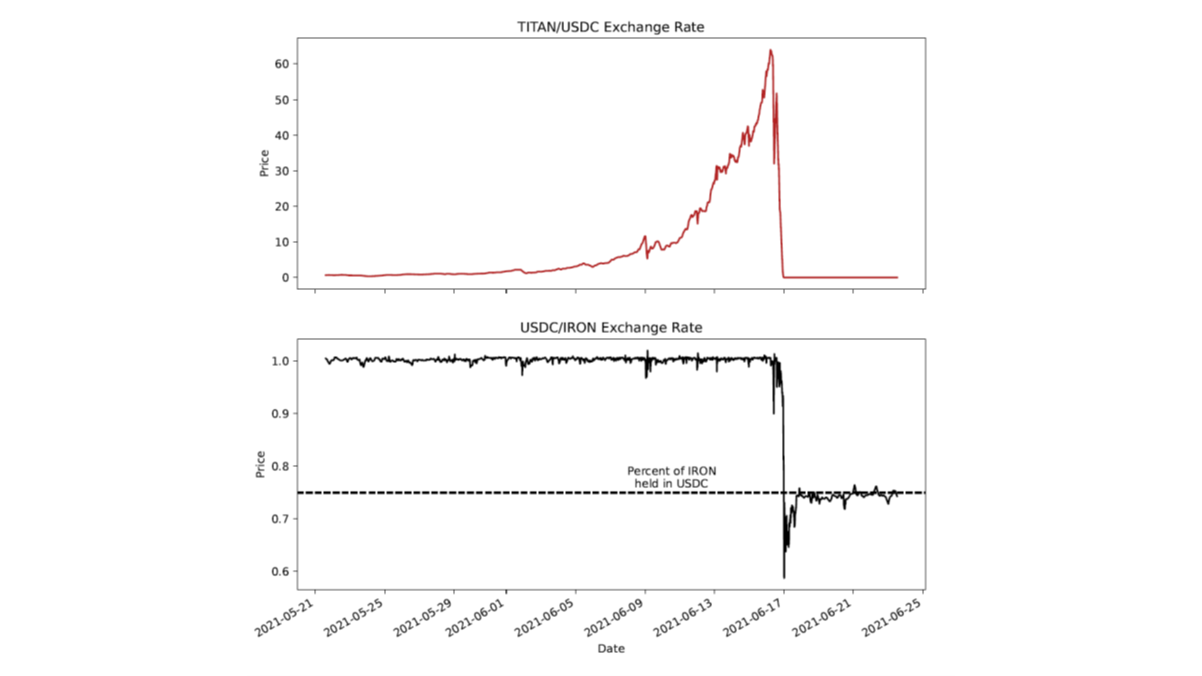
During the June 16 run, a Polygon transaction and loss report described a $1,200 loss and failed transactions even at maximum gas settings. The account does not establish the protocol’s root cause, but it shows how network congestion removed the practical exit while the collateral mechanism was deteriorating. A theoretical redemption is not protection when it cannot be executed.
The practical response was to treat TITAN collapse, persistent IRON discount, and failed Polygon transactions as one deteriorating exit. Federal Reserve account data showed the largest balance decile reducing holdings by close to 100% during the run while smaller accounts became net buyers. The remaining collateral percentage was not equivalent to an executable recovery price.
3. TerraUSD (UST): Uncollateralized Algorithmic Death Spiral
The collapse of TerraUSD (UST) in May 2022 remains the most catastrophic depeg event in crypto history. UST relied on an algorithmic relationship with its volatile sister token, LUNA; a CFTC commissioner’s account of the episode describes a run on UST followed by a sell-off in its companion token.
Once UST traded materially below its target, redemptions expanded LUNA supply while LUNA’s market value was falling. The support mechanism became reflexive: weaker confidence increased redemptions, more LUNA entered the market, and the asset intended to absorb the pressure became less capable of doing so.
The scale of that dilution made recovery progressively less credible. The New York Fed’s Terra run analysis recorded LUNA supply rising from 365 million units on May 9 to more than 6 trillion by May 13. From May 7 to May 16, UST lost $17.17 billion in market value and LUNA lost another $20.77 billion.
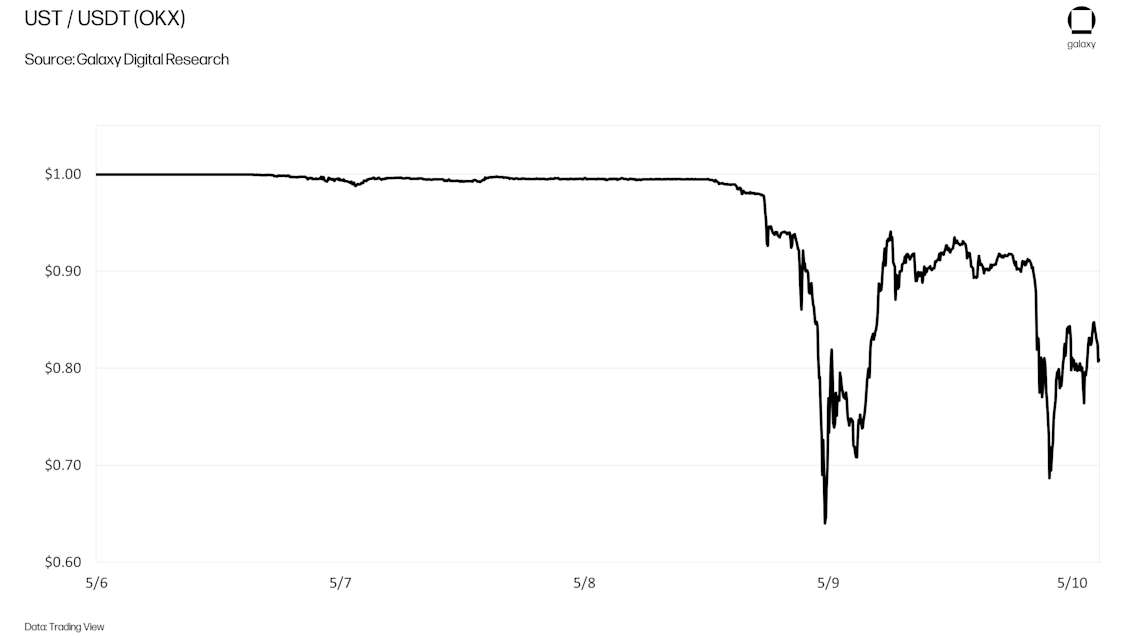
A May 10, 2022 Alice off-ramp report described account balances changing from USD to UST while cashing out required accepting the depeg loss. That experience does not measure every Terra exit, but it shows why an advertised peg was insufficient once the user’s actual conversion route stopped delivering one dollar of value.
The relevant response was to stop treating UST as dollar-equivalent and use an exit that did not depend on newly minted LUNA. CoinLineup’s stablecoin model comparison separates this reflexive structure from reserve-backed tokens; Anchor yield and previous repegs could not offset LUNA dilution or disappearing off-ramp liquidity.
4. Circle USDC: The Silicon Valley Bank Liquidity Shock
In March 2023, USDC experienced a temporary secondary-market depeg after Circle disclosed that $3.3 billion of the reserve was held at Silicon Valley Bank. The market discounted uncertainty about access to that cash even though the token’s reserve model had not changed.
Unlike Terra’s structural failure, the USDC event centered on temporary access to reserve cash. A joint statement from Treasury, the Federal Reserve, and FDIC said Silicon Valley Bank depositors would have access to all their money, removing the reserve-access uncertainty that had driven the discount.
Primary-market operations supplied the decisive recovery evidence. By March 15, Circle said it had cleared substantially all minting and redemption backlogs after redeeming $3.8 billion and minting $0.8 billion. A CryptoCompare review of the March depeg recorded $8.12 billion of centralized-exchange USDC volume on March 11.
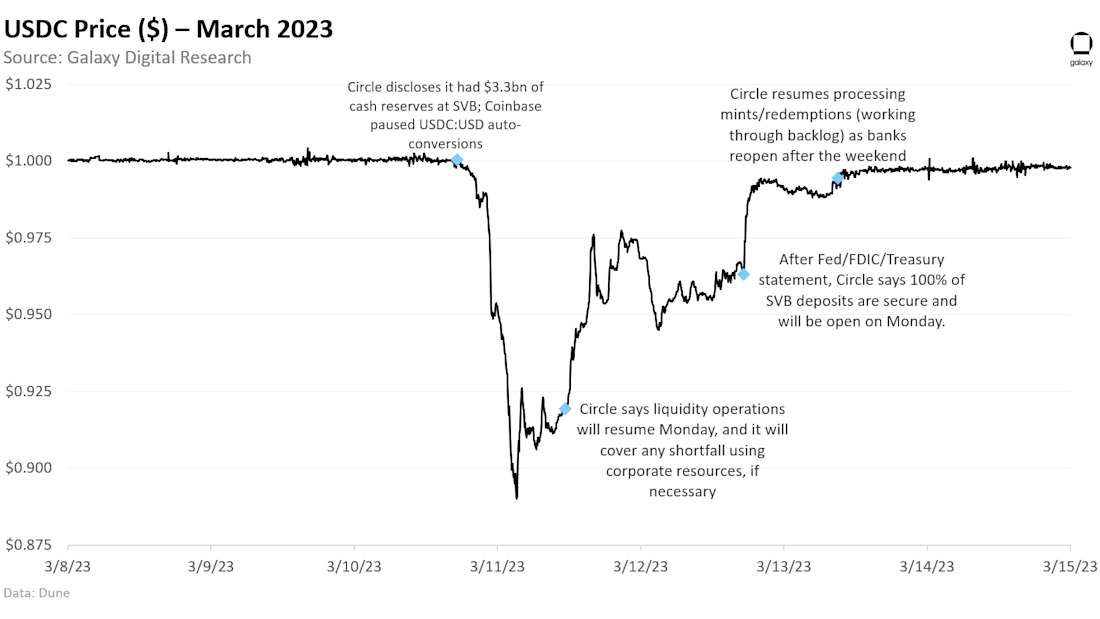
A March 22, 2023 USDC exit account described converting the full balance to ETH after USDC fell more than 10% while an OTC route was unavailable until Monday. ETH later rose, but that favorable outcome was incidental; replacing a depegging stablecoin with a volatile asset adds market risk to an already constrained exit.
Holders needing immediate liquidity still faced a real discount and route risk. Kraken’s depeg analysis records roughly 3,400 Aave liquidations tied to about $24 million of collateral during the event, with USDC making up 86% of that collateral. Recovery evidence therefore required protected bank access, completed redemptions, and renewed minting rather than an automatic assumption that fiat-backed tokens return to one dollar.
5. Tether USDT: secondary-market stress with functioning redemption
USDT’s temporary discounts during market panics show that a liquid stablecoin can trade below $1 on exchanges even when its primary issuer route continues operating. The correct test is whether the discount is broad, whether order-book and pool depth remain usable, and whether qualified customers can still redeem through the issuer.
The May 2022 stress separated exchange pricing from issuer redemption. USDT fell to about $0.945 on a major venue, although exact lows varied by exchange. Tether reported that verified customers completed $7 billion of redemptions after May 11, and the market price returned toward parity within 24 hours.
That distinction still matters as USDT expands beyond exchange trading. CoinLineup’s report on USDT’s Brazil payment route shows a retail distribution channel, but access through a payment app is not the same as direct redemption with Tether.
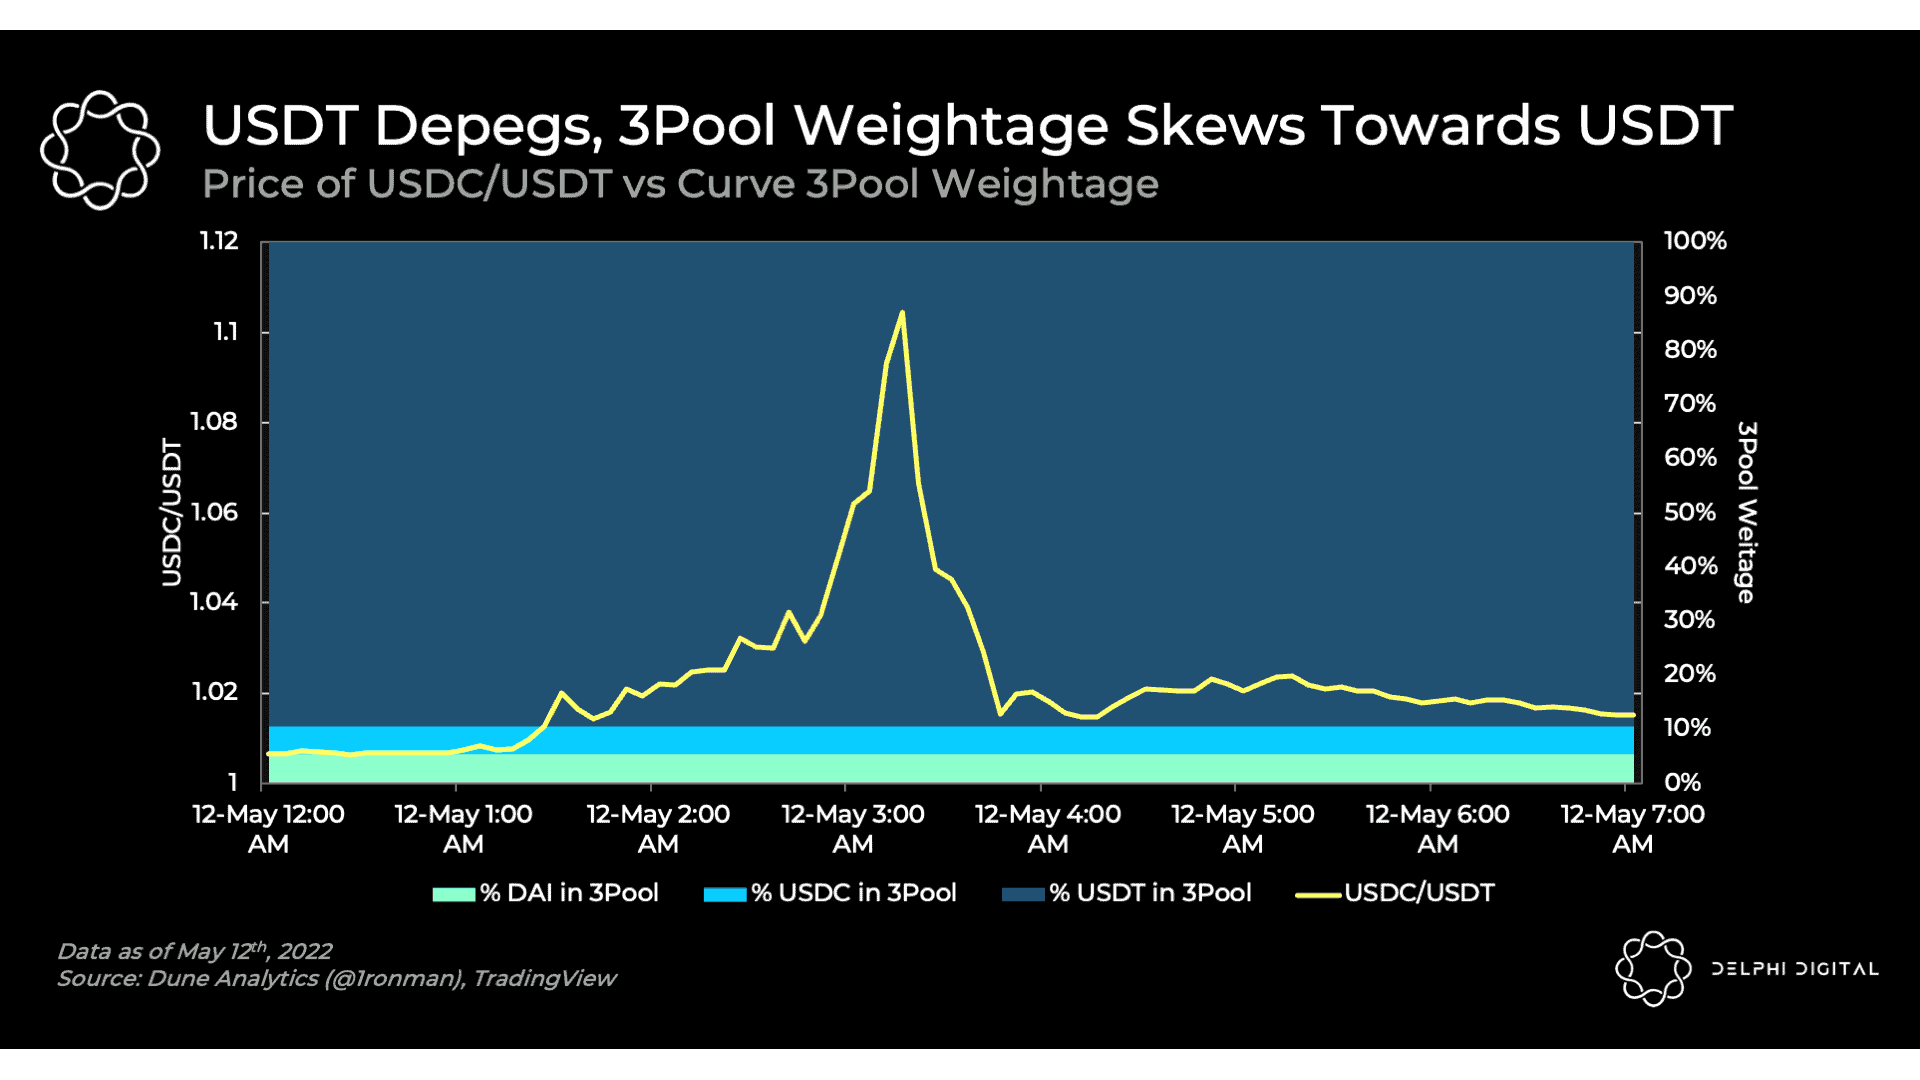
A May 11, 2022 live USDT stress report recorded roughly seven hours of below-par trading alongside unusually high volume as holders sought exits. This observation cannot verify Tether’s reserves, but it captures the market signal that mattered: persistent selling across time and volume was stronger evidence than one isolated price print.
The response depended on access. A verified Tether customer could evaluate direct redemption, while most retail holders had to compare CEX depth, DEX pools, fees, and withdrawal status. The event would have become more serious if issuer redemption paused or discounts persisted after exchange liquidity returned; neither condition defined the observed recovery.
6. First Digital USD (FDUSD): issuer-confidence shock
FDUSD fell to roughly $0.87 on April 2, 2025 after public claims questioned the solvency and liquidity of First Digital Trust. The episode shows a different fiat-backed failure path from USDC: the market repriced issuer and custodian confidence before a confirmed reserve loss, while the token’s concentrated exchange distribution made the shock visible quickly.
Spark’s event record places the event at about $2.5 billion of market capitalization and records recovery in roughly one day. First Digital disputed the insolvency claims, and its reserve attestation communication said the token remained backed 1:1 by U.S. Treasury bills. That evidence supports recovery analysis, but an attestation is not the same as immediate retail redemption for every holder.
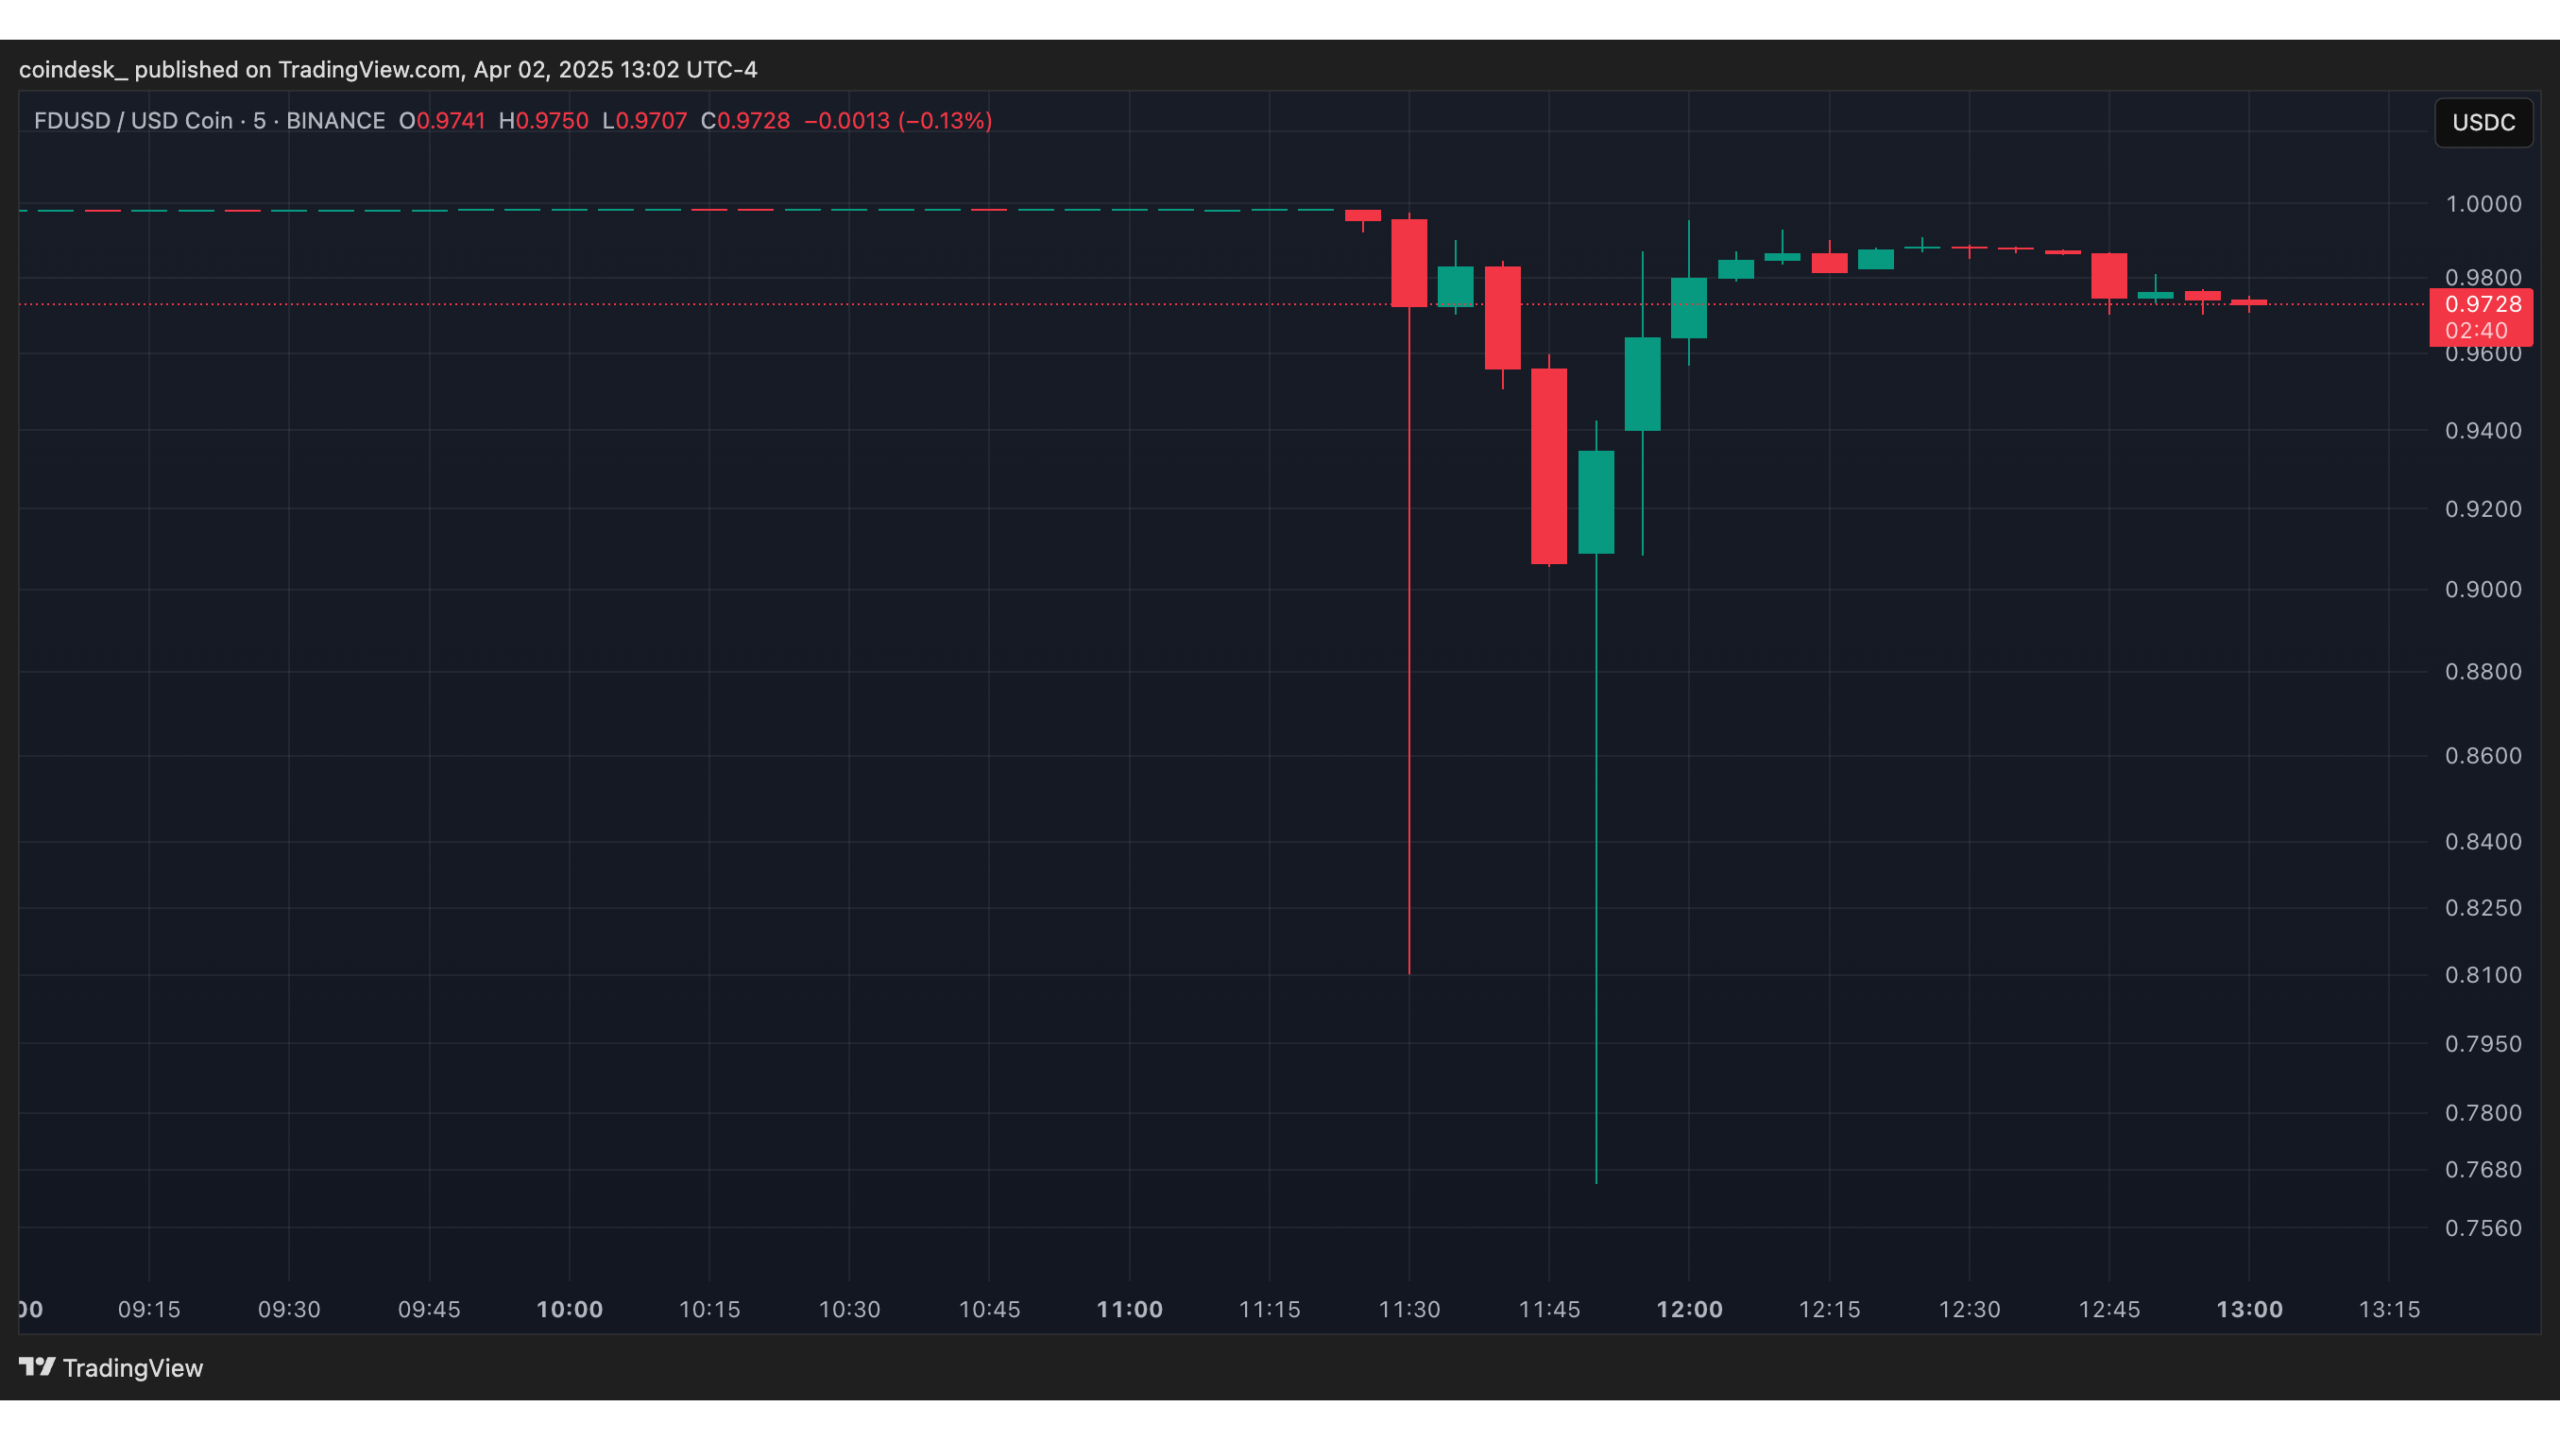
The practical check is therefore not only “is the reserve report positive?” It is whether the issuer can explain the allegation, whether redemption access remains open, and whether the main venues and chains still provide an executable exit. FDUSD recovered quickly, but the event remains a reminder that reserve claims and market confidence are separate variables.
Early Warning Indicators of Imminent Depeg Risk
Escalate a depeg alert only when several independent signals agree; one thin-pool trade or one delayed dashboard is not enough.
- Cross-venue price dispersion: Compare the canonical token on several liquid CEX and DEX venues. A broad discount is more serious than an isolated print.
- Pool imbalance and executable depth: Track whether the token is accumulating on one side of a pool and how much can still exit within the portfolio’s slippage limit.
- Redemption and issuer status: Check whether minting, redemption, banking access, reserve reporting, or settlement has changed.
- Collateral and liquidation pressure: For over-collateralized tokens, monitor collateral ratios, oracle updates, liquidation volume, and bad debt.
- Futures basis and funding: Where derivatives exist, persistent discounts or strongly negative funding can confirm hedging pressure, but they do not identify the cause alone.
- Large-wallet movement: Follow labeled transfers from protocols, treasuries, and exchanges, then distinguish real exits from internal reshuffling or bridge movement. A sudden supply increase also needs contract-level verification: CoinLineup’s report on the unauthorized minting that broke USR’s peg shows how a minting failure can overwhelm pools before ordinary reserve analysis becomes useful.
- Native-versus-bridged exposure: Compare the canonical contract with wrapped versions on every chain. A token can hold $1 on its issuer-supported route while a bridge, wrapper, or thin destination pool trades at a separate discount.
For automated monitoring, CoinGecko’s depeg guide describes a 0.5%-1% deviation as an early-warning band and supports REST polling, WebSocket streams, and webhooks. Treat that band as an alert setting, not a universal definition of depeg; confirm it across venues, contracts, and redemption routes.
Regulatory changes are a separate layer: CoinLineup’s report on the July 2028 stablecoin issuer compliance deadline tracks how reserve and disclosure obligations can change without proving that a token is currently depegging.
Conclusion
Depeg risk cannot be reduced to one asset model. Reserve access, collateral design, pool depth, bridge dependencies, issuer controls, and redemption determine whether a discount is temporary or structural. Monitor those conditions before a price alert fires, and reduce exposure when the canonical exit route stops functioning.
Frequently asked questions
Why did UST fail while USDC recovered?
UST redemptions created more LUNA while LUNA’s value was collapsing, so the recovery mechanism destroyed its own capacity. USDC retained identifiable reserves and returned to parity after protected bank access and normal redemption resumed.
How low did USDT trade during the May 2022 stress?
USDT traded near $0.945 on a major venue, but the exact low differed across exchanges. Its primary distinction from UST was that verified Tether customers continued redeeming at the issuer while secondary markets were stressed.
Did IRON recover after the TITAN collapse?
IRON did not return sustainably to $1. It settled near the surviving USDC-backed share after TITAN became effectively worthless, leaving holders with permanent impairment rather than a temporary liquidity discount.
Which signals separate a temporary depeg from a structural failure?
The strongest distinction is whether reserve or collateral value remains credible and whether redemption can still be executed. A broad discount, worsening pool imbalance, paused exits, and a failing stabilization asset together indicate structural risk.