USDT and USDC lead stablecoin market capitalization because their circulating supply, exchange reach, and transfer activity are materially larger than the next tier. USDS, DAI, USDe, USD1, and USDG occupy smaller positions whose supply and volume come from protocol collateral, synthetic-dollar demand, issuer distribution, or venue concentration.
The ranking is useful only when supply, market dominance, and volume are read together. DefiLlama’s stablecoin data gives the comparable supply and chain-distribution layer, while CoinLineup’s stablecoin fundamentals guide and cross-chain tracking guide explain why scale and reported activity still do not prove reserve quality, redemption access, or broad adoption.
Market-cap structure and measurement basis
USDT and USDC form the dominant market-cap tier, followed by protocol-backed, synthetic-dollar and newer issuer-led tokens. The ordering below is a reference structure, not a permanent live ranking. Their scale comes from different mechanisms, so the ranking must be read alongside turnover, recent supply change, holder concentration, and chain distribution.
DefiLlama’s stablecoin dashboard is the primary market-data source for this article. The market snapshot used below was captured August 19, 2026, with the same token mapping and supply definition across all seven profiles. The ranking and activity figures in this section use that same date; older behavioral research is kept out of the snapshot table.
| Reference order | Token | Share of total market | Scale signal | Activity signal | Trend and distribution signal | Model |
|---|---|---|---|---|---|---|
| 1 | USDT | 60.8% | Dominant supply and market share | Highest reported exchange and transfer activity | Mature, widely distributed across major routes | Fiat-backed |
| 2 | USDC | 23.9% | Large second market-cap tier | High activity across exchange, DeFi and payment rails | Broad multi-chain and institutional distribution | Fiat-backed |
| 3 | USDS | 2.2% | Upper-mid protocol-backed tier | Lower turnover than the two market leaders | Savings and collateral demand; concentrated in yield contracts | Protocol-backed |
| 4 | DAI | 1.6% | Mid-sized DeFi tier | Collateral and pool activity matter more than CEX volume | Borrowing, liquidation and pool depth drive the signal | Crypto-backed |
| 5 | USDe | 1.3% | Mid-sized synthetic-dollar tier | Yield and funding activity can dominate reported movement | Sensitive to hedge execution, funding and concentrated ownership | Synthetic dollar |
| 6 | USD1 | 1.3% | Mid-sized newer-issuer tier | Venue-sensitive and potentially high turnover | Distribution concentrated across BSC, Ethereum, and Solana | Fiat-backed |
| 7 | USDG | 1.1% | Mid-sized growth tier | Activity can be influenced by rewards and exchange programs | Supply concentrated on Solana and a small set of venues | Fiat-backed |
The total tracked stablecoin market in this snapshot was about $300.865B. The percentages above use that full-market denominator, not only the seven tokens; the seven profiles together account for roughly 92.3% of tracked supply.
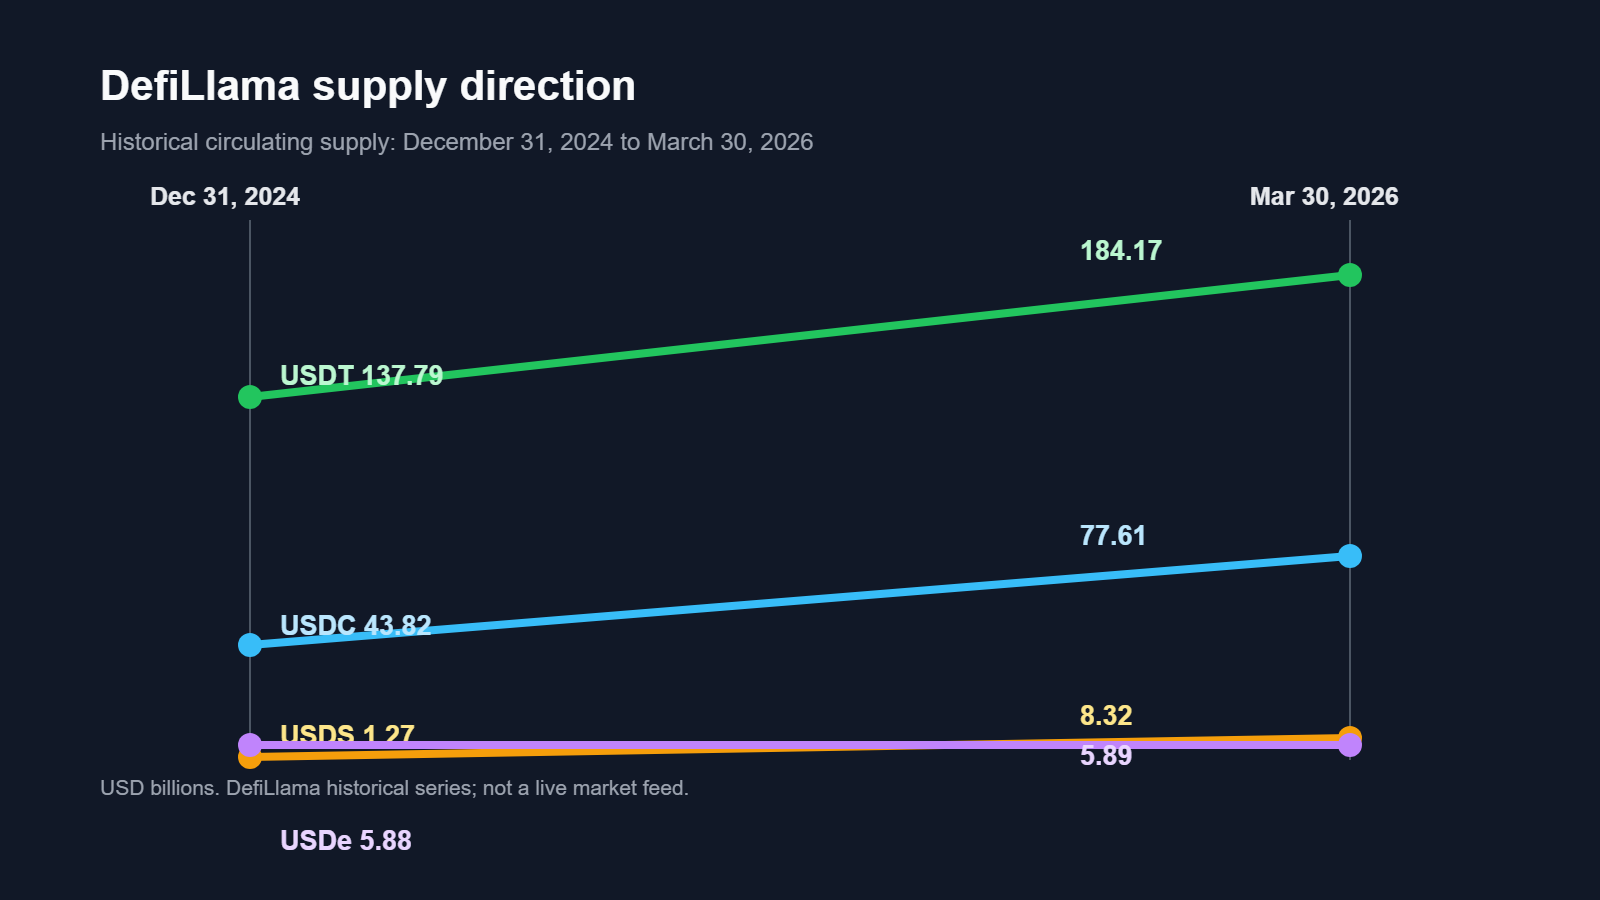
Market share and turnover are not interchangeable. USDT combines the largest supply with the deepest reported activity, while a smaller token can show high turnover because of venue concentration or incentives. A fast-growing token still needs a retention check before its market-cap movement is treated as durable adoption.
What each ranked stablecoin actually represents
1. USDT
USDT is the main trading and transfer dollar in this group. Exchanges, market makers, and cross-border users choose it for pair coverage and route liquidity, so its first-place position reflects where crypto markets already move size rather than a standalone safety verdict.
- Supply: The market-data series records about $182.94B of USDT in the August 19, 2026 snapshot. That is the clearest scale signal in this set, but the article still needs the chain split before calling the balance globally liquid.
- Dominance: USDT represents about 60.8% of the full tracked market and roughly 65.8% of these seven tokens. Its dominance is visible in the data, while the practical check remains network-specific depth on Tron, Ethereum, and the selected withdrawal route.
- Volume: The historical Dune sample recorded roughly $700B of USDT activity on each of the Tron and Ethereum routes in one month. Treat that as route activity, not unique-user adoption; inspect pair, venue, spread, and withdrawal depth before using the number.
A freelancer’s USDT-to-euro withdrawal discussion described receiving USDT for work in Spain and then needing an exchange and bank route to convert it into euros. That experience does not challenge USDT’s global liquidity; it shows the boundary between token liquidity and a usable local exit. The practical check is the recipient’s country, supported network, off-ramp, and withdrawal policy.
2. USDC
USDC is the large regulated-settlement alternative to USDT. Its role stretches across payment processors, institutional wallets, exchanges, and Layer-2 applications, which gives its market position a different base of demand from exchange-only liquidity.
- Supply: The same series records about $71.96B of USDC in the August 19, 2026 snapshot. Read that balance alongside the native-versus-bridged split; a lower balance on one chain may be migration rather than lost demand.
- Dominance: USDC represents about 23.9% of the full tracked market and roughly 25.9% of these seven tokens. That second-place share is large enough to support broad distribution, but it does not make every contract, bridge, or local off-ramp equally usable.
- Volume: The historical Dune sample recorded about $2.6T on USDC Base and $1.6T on USDC Ethereum in one month. Those figures are meaningful only after separating payment, DeFi, exchange, and internal routing flows.
An independent contractor’s USDC-to-EUR payment discussion described the real friction after receiving USDC: moving from a wallet through an exchange into a euro bank account and handling the accounting trail. The experience supports USDC’s transfer utility but also qualifies the market-cap story: local conversion, tax records, and the correct network determine whether that utility is usable.
3. USDS
USDS is primarily a Sky ecosystem dollar used around savings, collateral, and DeFi positions. It can be useful for a treasury or protocol user seeking that integration, but its market position should not be read as evidence of broad merchant or remittance use.
- Supply: The historical series records about $6.71B of USDS in the August 19, 2026 snapshot. That balance tracks a Sky ecosystem shift, so the next check is how much sits in savings and collateral contracts rather than payment wallets.
- Dominance: USDS represents about 2.2% of the full tracked market and roughly 2.4% of these seven tokens. The smaller share makes concentration more important: a large Sky-linked balance can lift the rank without creating broad merchant distribution.
- Volume: A comparable public volume figure is not used here because USDS activity is split between savings, collateral, and DeFi pools. The useful operational test is pool depth plus the route from USDS or sUSDS back to a liquid dollar market.
An early-stage treasury operator’s USDS discussion described keeping USDC for payments while moving idle treasury exposure into sUSDS for the savings rate and collateral model. That is a concrete use-case boundary, not a popularity claim: USDS can serve a yield-oriented treasury role while remaining less suitable for a business that needs simple dollar settlement.
4. USDe
USDe is a synthetic dollar built around a hedged, yield-oriented strategy rather than ordinary cash settlement. Users are therefore choosing exposure to Ethena’s funding, custody, redemption, and staking design as well as holding a dollar-denominated token.
- Supply: The historical series records about $4.04B of USDe in the August 19, 2026 snapshot. That balance makes funding, yield, and redemption conditions more important than a simple growth narrative.
- Dominance: USDe represents about 1.3% of the full tracked market and roughly 1.5% of these seven tokens. The number is large enough to matter in DeFi, but still exposed to holder concentration, hedge execution, custody, and funding-regime changes.
- Volume: The relevant volume is not just exchange turnover. Track sUSDe movement, pool liquidity, redemptions, and funding-linked activity separately; otherwise a strategy rotation can be mistaken for ordinary stablecoin settlement.
A USDe user discussion about staking and exit timing focused on how exiting a position could affect campaign rewards while retaining USDe. That experience illustrates the product’s yield-and-incentive behavior rather than proving stability; readers should treat cooldowns, reward conditions, and redemption timing as part of the volume analysis.
5. DAI
DAI is the established crypto-backed dollar in this comparison. Its practical importance comes from vaults, lending markets, and DEX pools, where collateral rules and liquidation mechanics matter more than its global exchange rank.
- Supply: The historical series records about $4.77B of DAI in the August 19, 2026 snapshot. That scale points to an established DeFi balance, but accepted collateral and liquidation rules determine how much of it can actually be used.
- Dominance: DAI represents about 1.6% of the full tracked market and roughly 1.7% of these seven tokens. Its market share understates its relevance inside lending markets, where collateral and liquidation rules matter more than rank.
- Volume: No single aggregate DAI volume number is treated as decisive here. Separate vault borrowing, liquidations, swaps, and exchange flows; the practical liquidity test is the depth of the relevant DAI pool at the moment of exit.
A recent Aave user discussion about DAI collateral described a position becoming harder to manage after DAI collateral received a zero-LTV setting, requiring a gradual swap into an accepted stablecoin. The account is one user’s experience, not proof of a universal Aave outcome; it demonstrates why DAI analysis must include governance and collateral eligibility alongside supply.
6. USD1
USD1 is a newer issuer-led dollar whose growth is closely tied to exchange and ecosystem distribution. Its position can rise quickly when a major venue adopts it, so the central question is whether the balance is used across independent workflows or remains concentrated in associated markets.
- Supply: The historical series records about $4.01B of USD1 in the August 19, 2026 snapshot. The balance requires a distribution check: identify which chains, venues, and wallets hold it before treating the rank as broad adoption.
- Dominance: USD1 represents about 1.3% of the full tracked market and roughly 1.4% of these seven tokens. Its rank is therefore more sensitive to one exchange or ecosystem than USDT or USDC, so concentration is part of the market-share result.
- Volume: USD1 volume should be classified into settlement, collateral, derivatives, and incentive flows. The reported number is not decision-ready until venue concentration and transaction labels show whether activity extends beyond one associated pair.
A community discussion about USD1 trading activity questioned whether a large reported volume figure represented actual use or concentrated activity in a single pair. The thread is a skeptical community observation, not an independently verified wash-trading finding; the correct editorial response is to check venue concentration and transaction labels before treating USD1’s volume as adoption.
7. USDG
USDG is a newer platform-linked dollar positioned around exchange access, distribution, and lending-related use. Its smaller base means platform incentives or account restrictions can affect the practical experience much faster than the headline market-cap rank suggests.
- Supply: The historical series records about $3.40B of USDG in the August 19, 2026 snapshot. That growth still needs a platform-distribution check before it is treated as independent payment demand.
- Dominance: USDG represents about 1.1% of the full tracked market and roughly 1.2% of these seven tokens. At that size, a few wallets or platform balances can materially change its rank; the percentage should not be read as broad market penetration.
- Volume: USDG needs a platform-level volume split between trading, lending, rewards, and ordinary transfers. A promotional lending balance can expand reported activity while leaving the actual payment footprint small.
A Robinhood user discussion about USDG lending described buying USDG for a promoted lending return and then experiencing restrictions on withdrawals and other account activity. That account is not proof that every USDG user faces the same outcome, but it is a relevant operational warning: analyze platform custody, lending terms, withdrawal controls, and reward dependence separately from USDG’s market-cap rank.
Market dominance, volume, and chain structure
Market-cap dominance reflects circulating supply and distribution, not superior safety. USDT and USDC form the clear large-cap pair, while the other five tokens represent protocol, synthetic-dollar, issuer, or incentive-led activity. DefiLlama chain balances show where supply sits; volume and holder data show whether that supply is moving broadly or through a narrow set of venues. Read those layers together rather than treating one token ranking as a complete market verdict.
Volume must be read beside market cap. Historical Dune data counted about $6.4 trillion across nine token-chain pairs in one month: USDC on Base about $2.6 trillion, USDC on Ethereum about $1.6 trillion, and USDT on Tron and Ethereum about $700 billion each. The figures show why chain and venue can change the volume story more than global rank. Dune’s stablecoin research adds chain, holder, and transfer context.
The BIS estimated annual stablecoin transaction volume at about $28 trillion in 2025, but the economic total is smaller after removing transfers between wallets controlled by the same owner. Gross volume therefore needs a filtering method before it is called adoption.
Crypto trading remains a major use case, so supply should not be presented as proof of payment adoption. The useful reading sequence is scale, activity, chain location, holder concentration, peg behavior, and redemption evidence.
DefiLlama market-cap and trend snapshot
The DefiLlama stablecoin dashboard is the only market-data source used in this article. The table below keeps the same August 19 snapshot as the ranking above and adds DefiLlama’s one-month change and peg signal. Reported volume share and daily turnover are intentionally excluded because they require a different provider and would break the single-source method.
| Token | Market share | 30-day change | Current peg signal | What the same-source data shows |
|---|---|---|---|---|
| USDT | 60.8% | -0.60% | -0.06% | The largest supply remains dominant despite a modest one-month contraction. |
| USDC | 23.9% | -1.93% | -0.03% | The second-largest supply has declined more than USDT over the same window. |
| USDS | 2.2% | +0.69% | +0.01% | Supply is expanding slightly while the peg remains close to target. |
| DAI | 1.6% | -1.62% | 0.00% | The DeFi dollar is broadly at peg but contracted over the month. |
| USDe | 1.3% | +0.55% | -0.03% | Synthetic-dollar supply grew slightly, with a small negative peg deviation. |
| USD1 | 1.3% | -6.08% | -0.08% | The sharpest contraction in this set makes distribution and retention important checks. |
| USDG | 1.1% | +7.59% | 0.00% | The fastest one-month expansion needs to be separated from platform-linked incentives. |
This same-source view keeps scale, trend, and peg movement comparable. It does not claim that market cap proves trading liquidity or payment adoption; those require a separate research layer and are not inserted as incompatible provider metrics.
Trading Dollar, Payment Rail, and Yield Dollar
The same market-cap ranking contains three different product roles. Dune’s June 2026 behavior map helps separate those roles from raw supply and reported volume:
- Trading Dollar: USDT and USDC are the main market-plumbing tokens. USDC on Base was associated with roughly 20x daily turnover and about 96% flashloan or DEX-liquidity activity, while USDT’s deepest routes support exchange settlement and transfer flows. High turnover here signals active markets, not automatically merchant adoption.
- Payment Rail: USDT on Tron has the clearest transfer profile in this set. Dune’s June snapshot found about 79% plain-transfer activity and 93% ordinary-wallet supply on Tron; its first-half 2026 commerce estimate was about $95 billion, versus about $14 billion for USDC. The chain matters as much as the ticker.
- Yield Dollar: USDe and USDS are mainly held through yield-bearing positions rather than used as everyday payment balances. About 63% of USDe sat in sUSDe and about 89% of USDS sat in sUSDS in Dune’s snapshot, with top-ten concentration near 94% for both. Their supply therefore measures strategy demand more than payment reach.
Conclusion
Market cap rankings confirm a USDT-USDC duopoly, but the next tier behaves differently. USDS and DAI are protocol-backed, USDe is yield-sensitive, USD1 shows concentrated high turnover, and USDG shows rapid incentive-linked growth. Monitoring supply, turnover, chain distribution, and holder concentration together gives a more reliable view than market cap alone.
Frequently asked questions
What does a stablecoin market-cap ranking reveal?
It reveals relative circulating scale and market concentration. It does not prove reserve quality, redemption access, payment adoption or safety.
Why can trading volume exceed market cap?
The same units can change hands repeatedly across exchanges, pools and chains. High volume may reflect genuine settlement, exchange routing, incentives or repeated internal transfers.
Why can a smaller stablecoin show higher turnover?
A smaller supply can be concentrated on an active exchange or incentive program. Turnover must therefore be checked against venue mix, holder concentration and repeat activity.
What should be checked after reading the ranking?
Check the token’s chain distribution, volume methodology, holder concentration, peg history and redemption route before treating the rank as evidence of adoption or liquidity.


